Summary The toll of deaths and other consequences Deaths per day New cases per day UK "Global Death Comparison" chart UK nation and regional comparisons Poor UK Government decision making NHS/PHE labs are being denied testing reagents Unspecified case location in 70% of UK cases Problems with the covid-19 science Problems with the media and covid-19 Reasons to be concerned Reporting delays in Liverpool for covid-19 tests Action needed Elimination of the virus ("Zero covid") Elimination successes Population ("herd") immunity Countries with the best covid-19 control: half-lives of 5 days When to end the UK lockdown Predicting epidemics - Q and A R values, doubling times and halving times Data sources Data sources for covid-19.php Seven principles of public life in the UK Myths and misinformation About
New cases per day
Different countries have responded very differently to the covid-19 pandemic, and this is reflected in the number of cases they have experienced.
Cases are currently rising in many countries and the UK is currently (data of 27 Oct 2020) the tenth worst out of the larger European countries, with a case doubling time of 24 days:
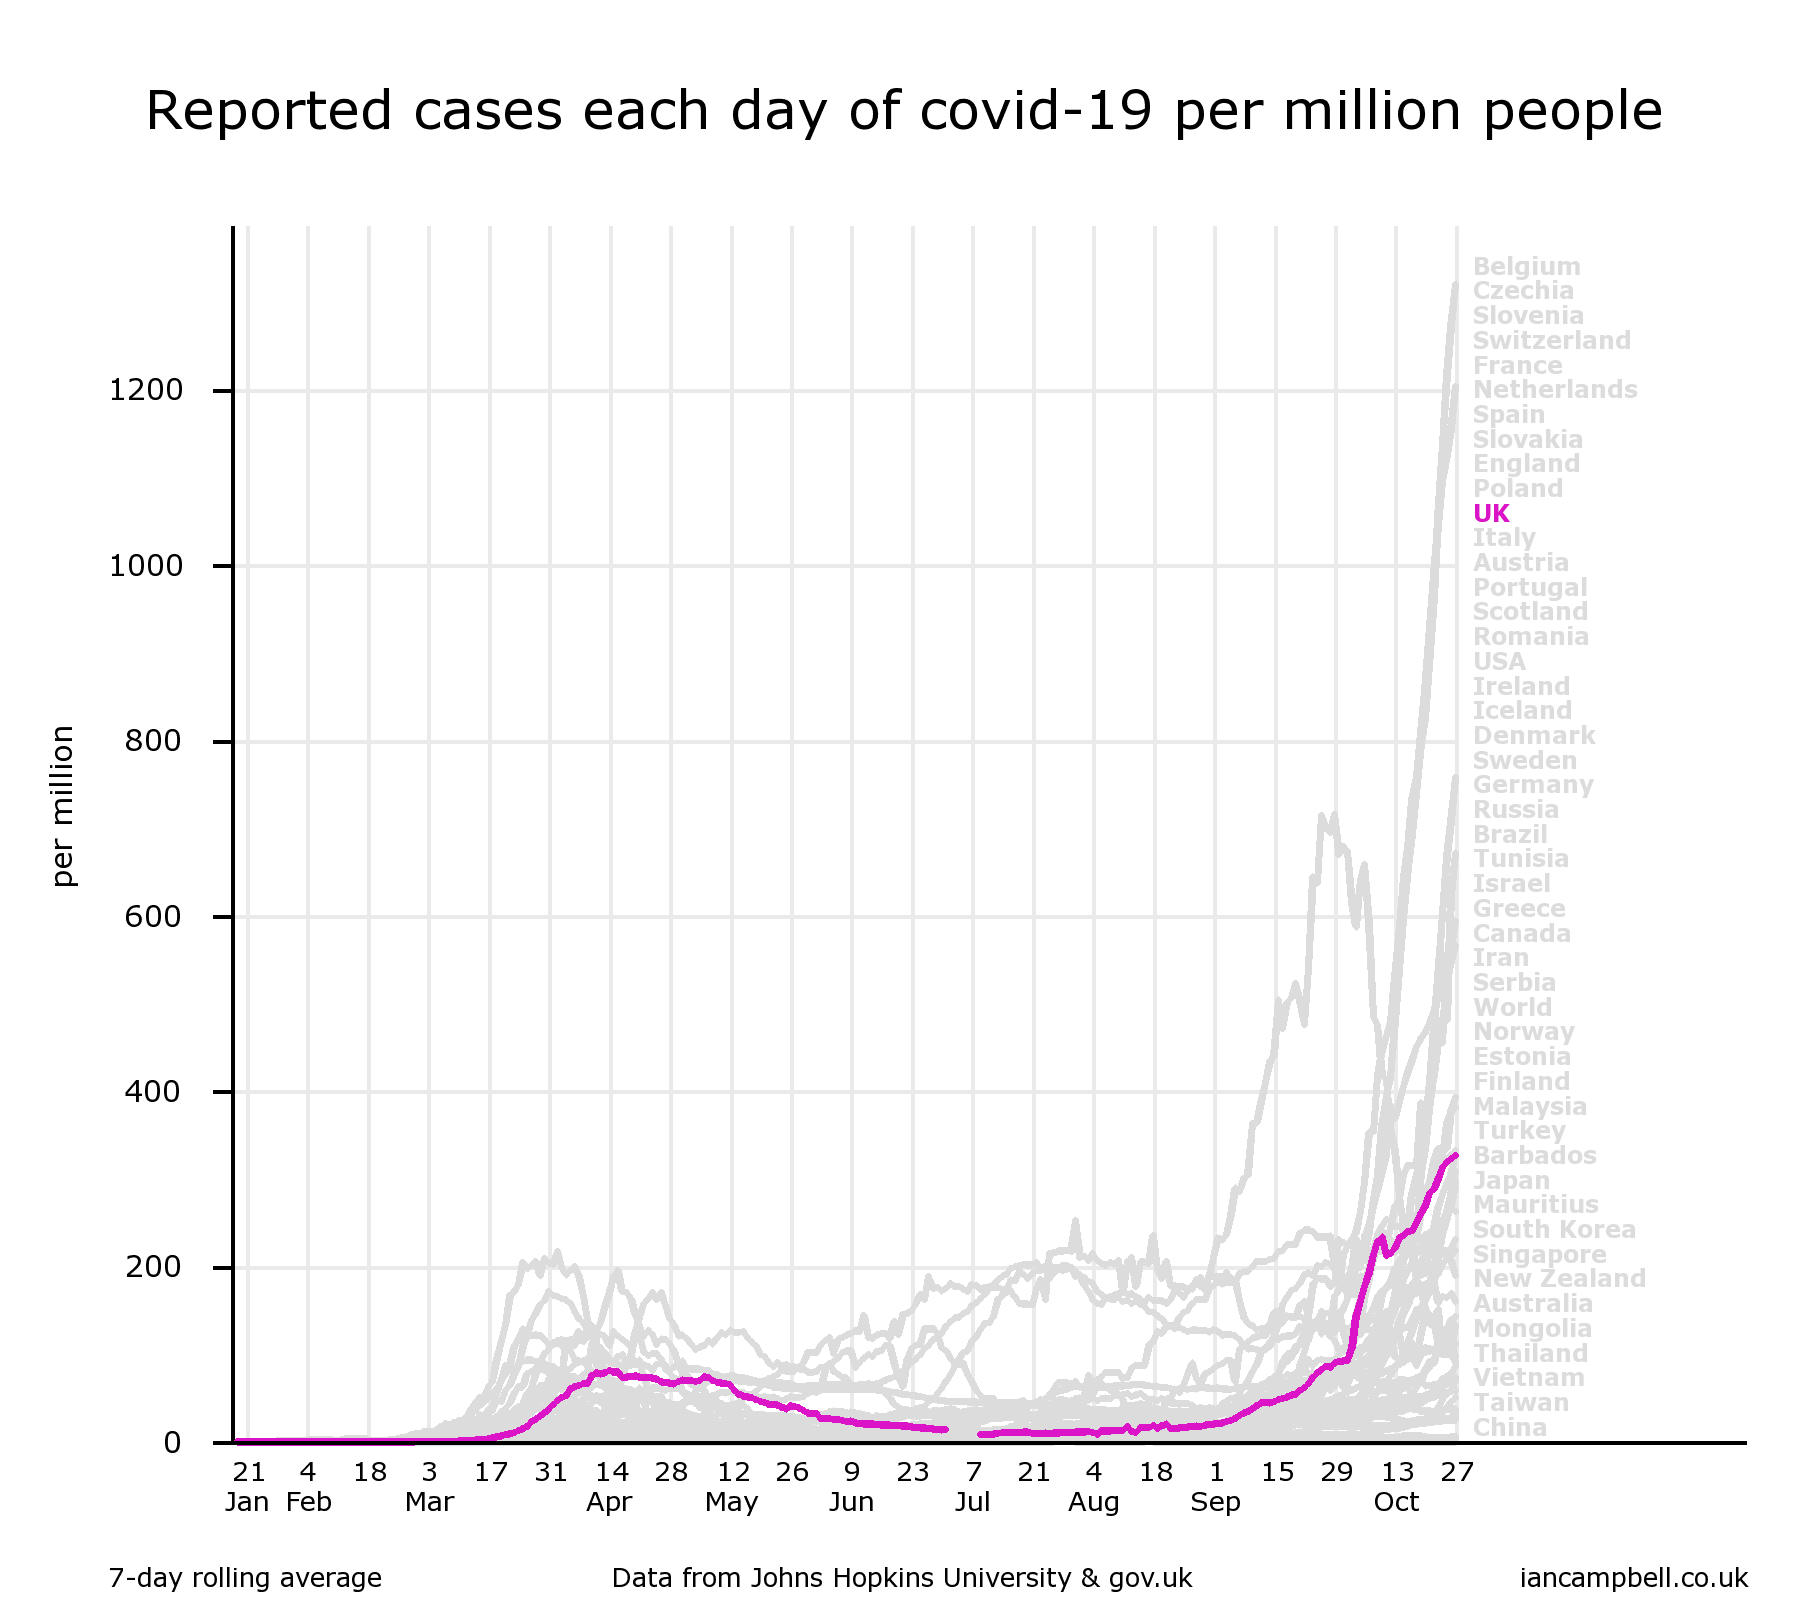
Trends in epidemics are often easier to see when logarithmic plots are used (more here) - as in the following chart:
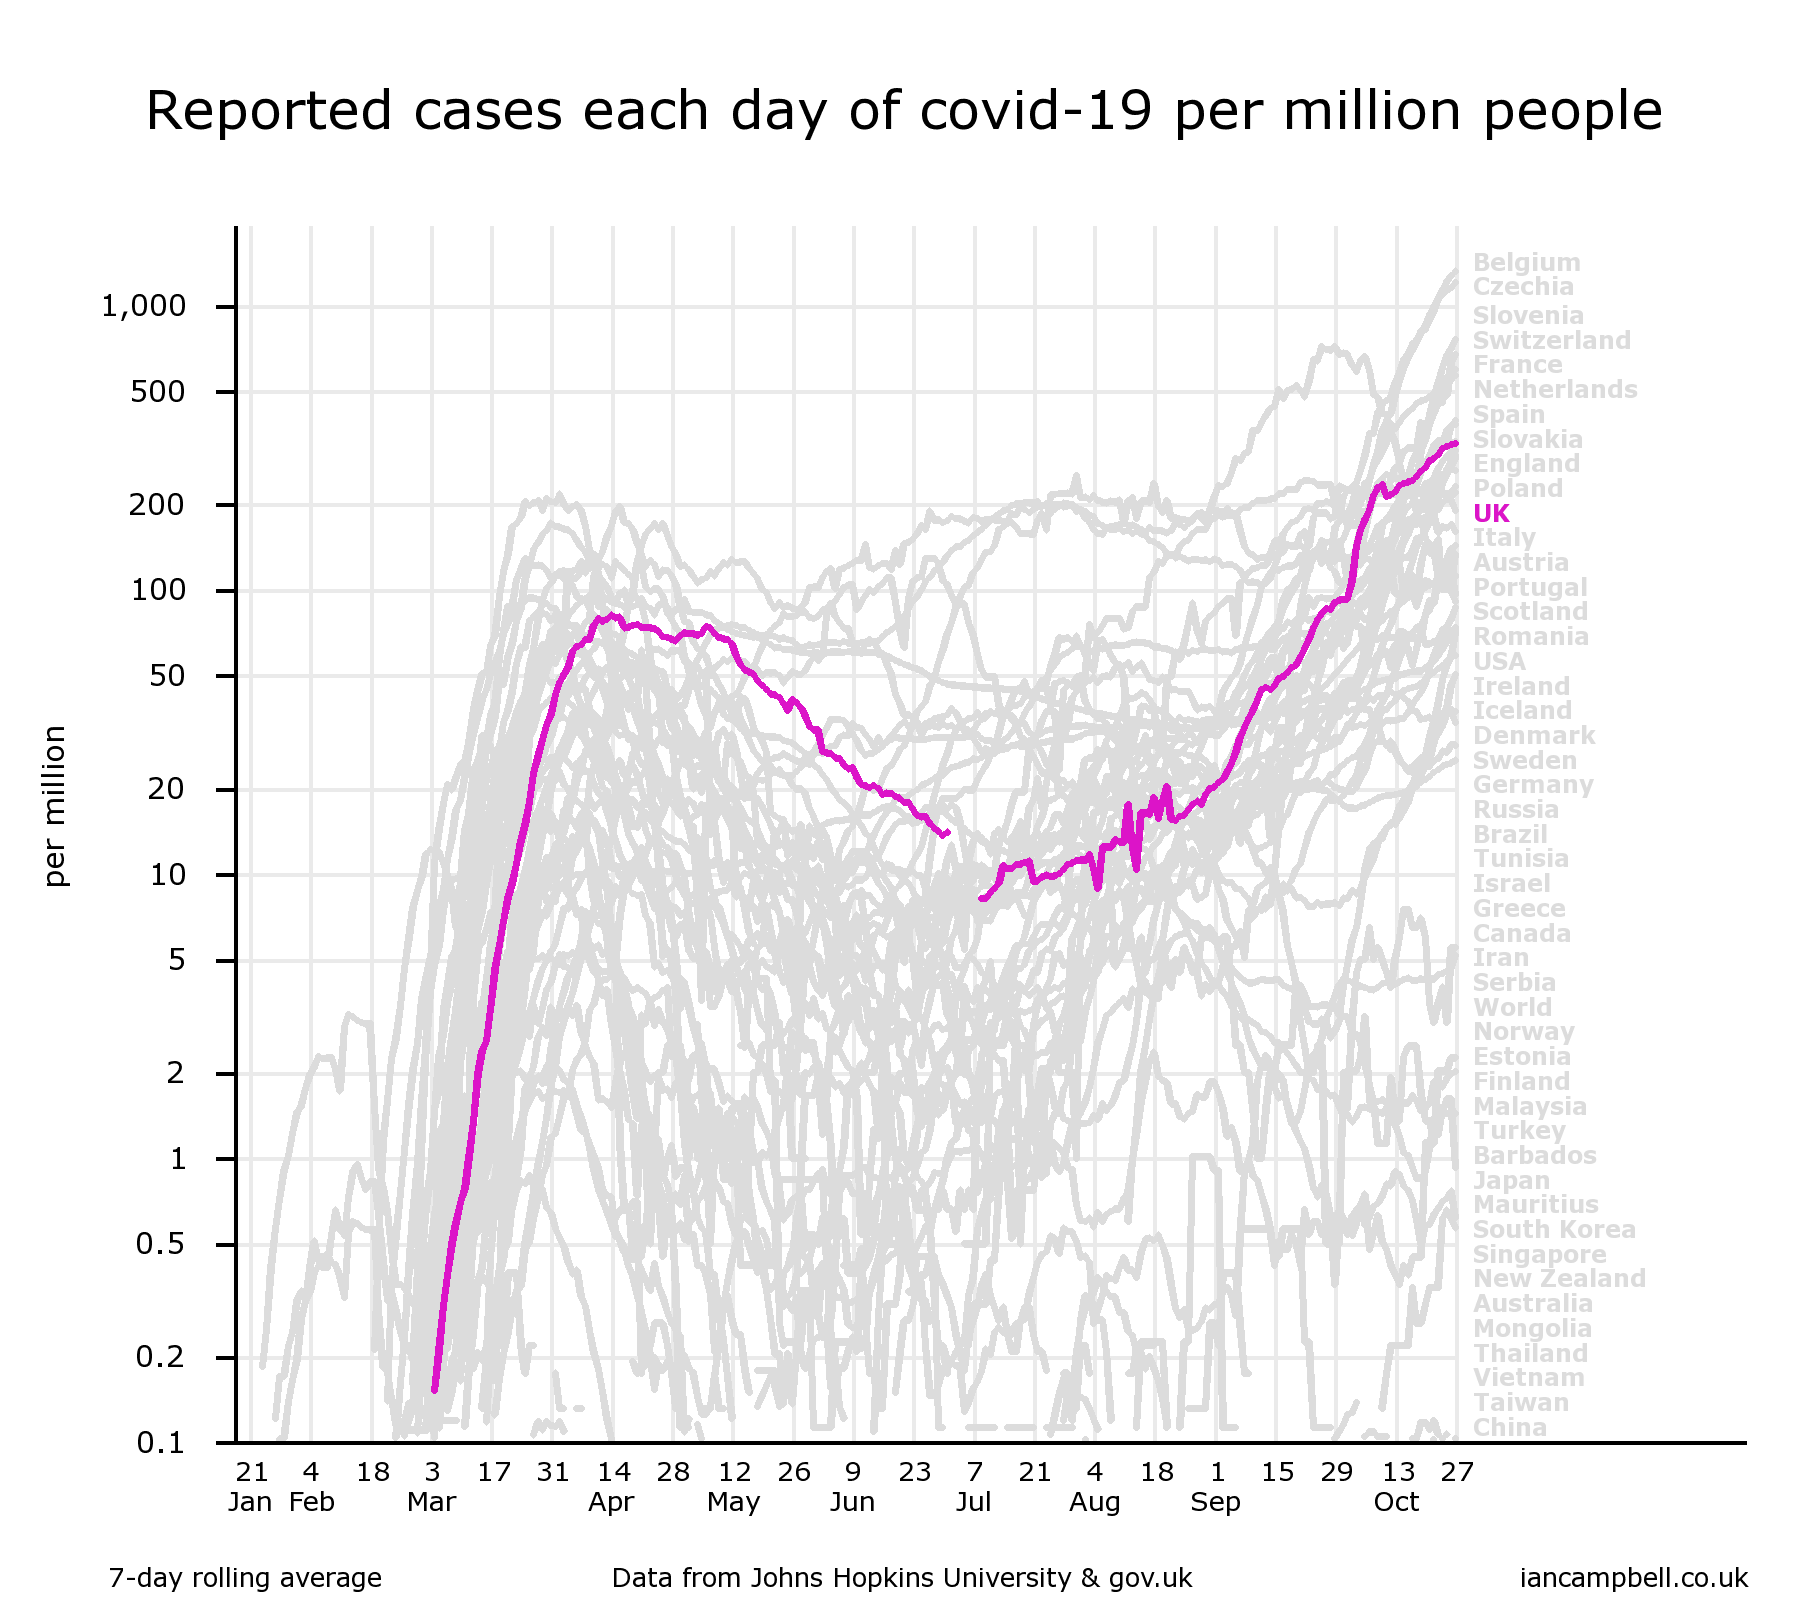
There are two patterns.
A. Inadequate control
In some countries
- cases rose rapidly
- after delays, strict measures were imposed which halted the rise in cases, and resulted in gradual declines
- the measures were then relaxed too far and too soon so that cases are now rising again.
B. Elimination and surveillance
In other countries:
- early vigorous action halted the spread
- effective local testing and tracing eliminated the virus or reduced cases to very low levels (e.g. 1% of those in the UK)
- outbreaks (generally from infected travellers) have been eliminated by further local action
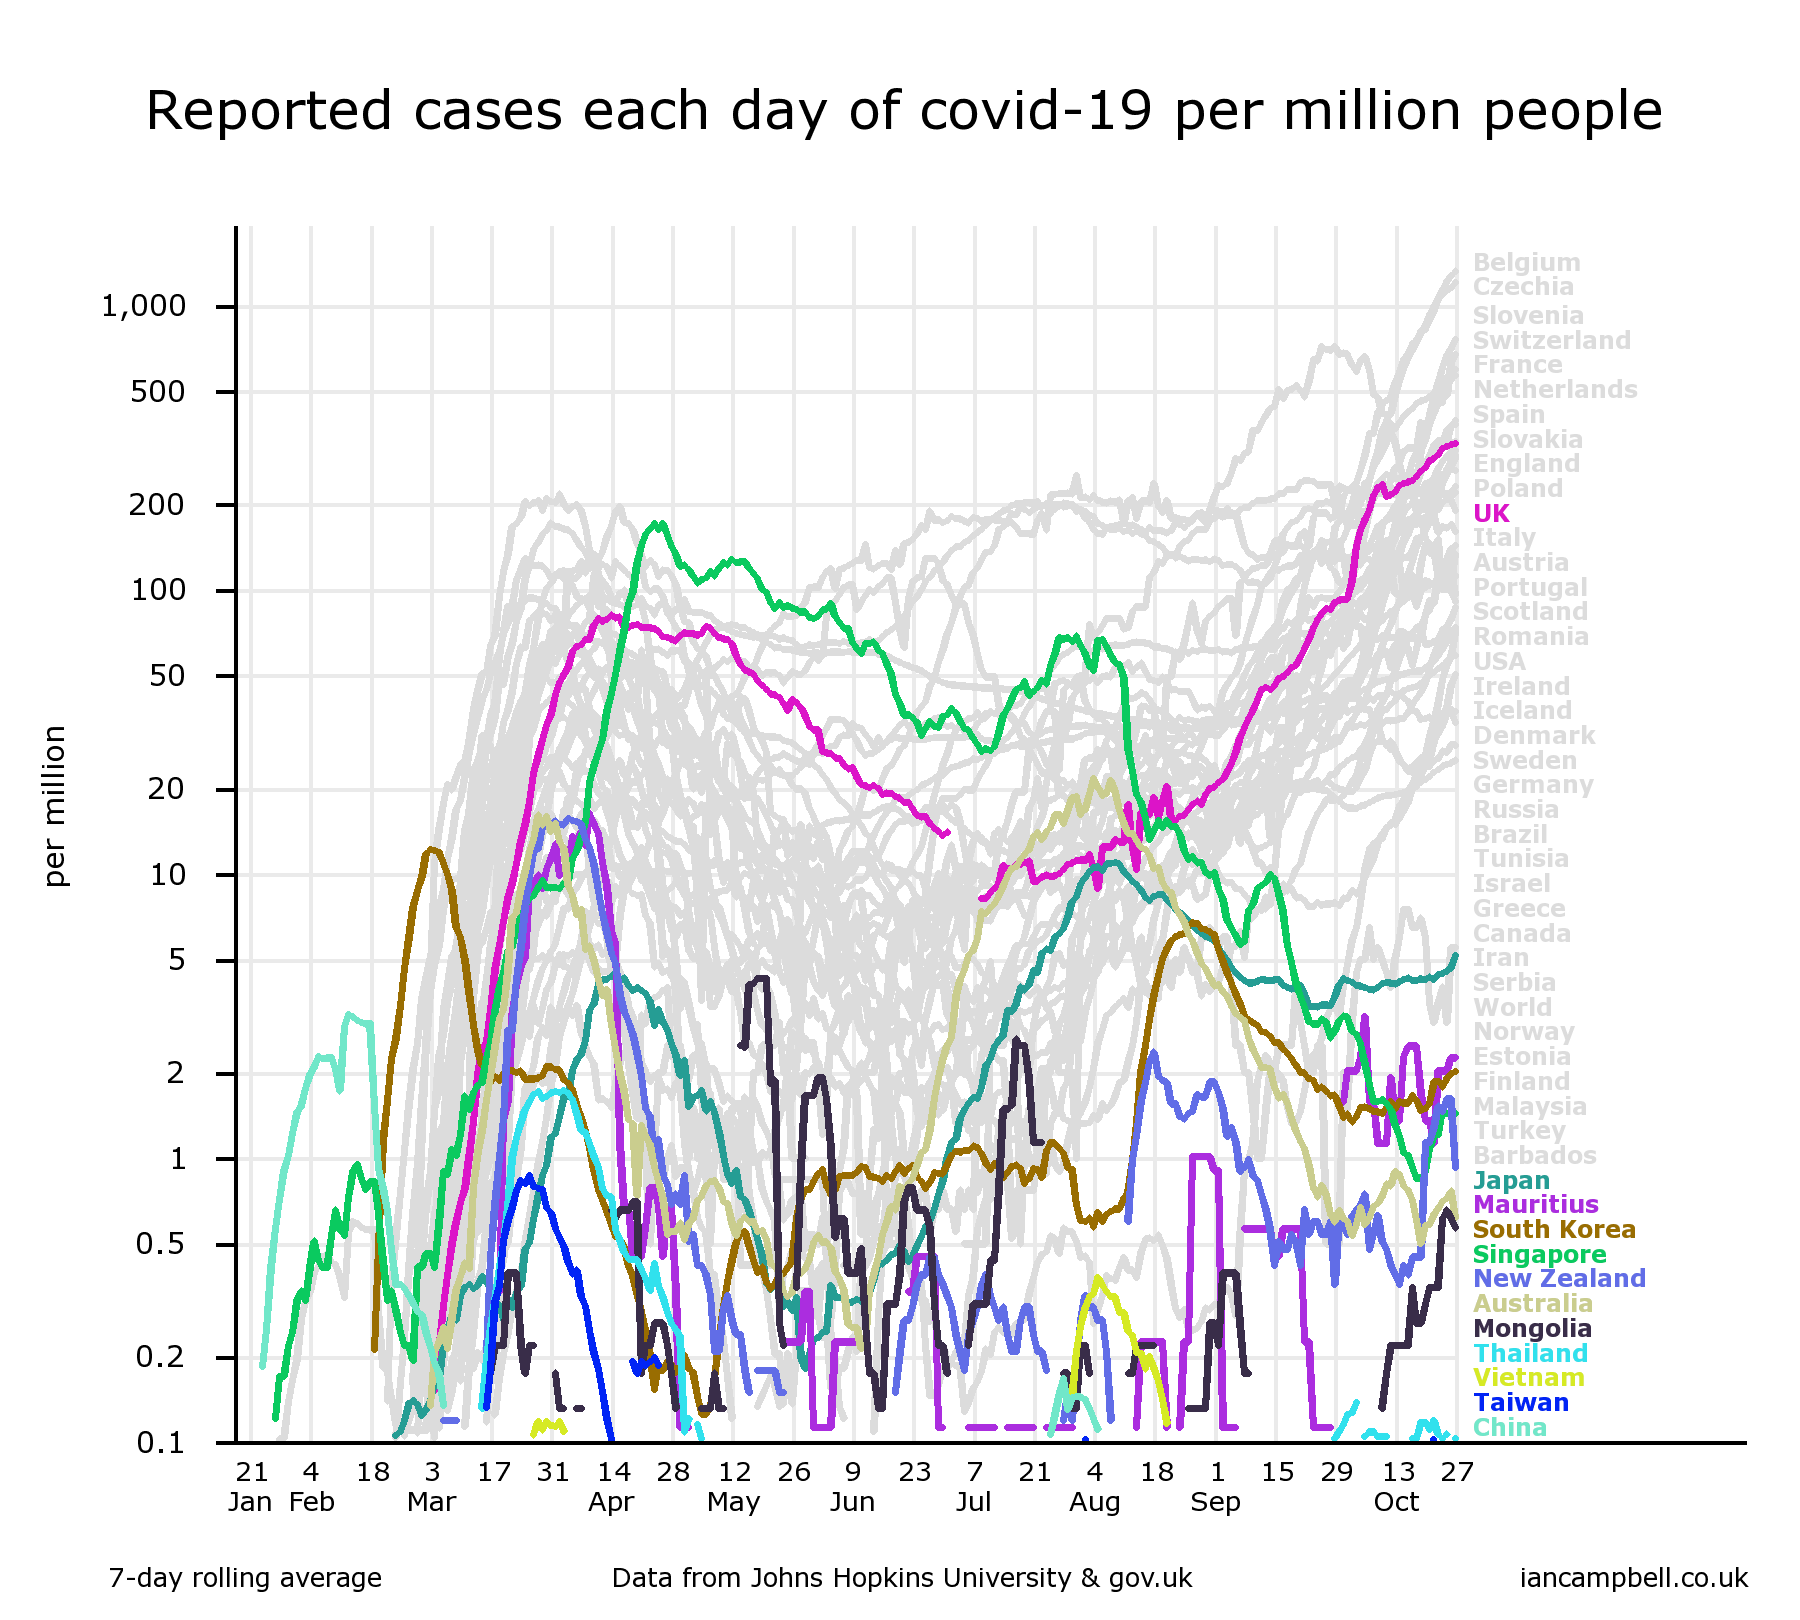
Without control, cases will continue to rise until action is taken to halt transmission of the virus - the most effective being a good test-trace-isolate-support system.
Geographical distribution
Cases are distributed throughout the UK. Currently (data of 28 October) all local authorities have had cases reported in the last seven days.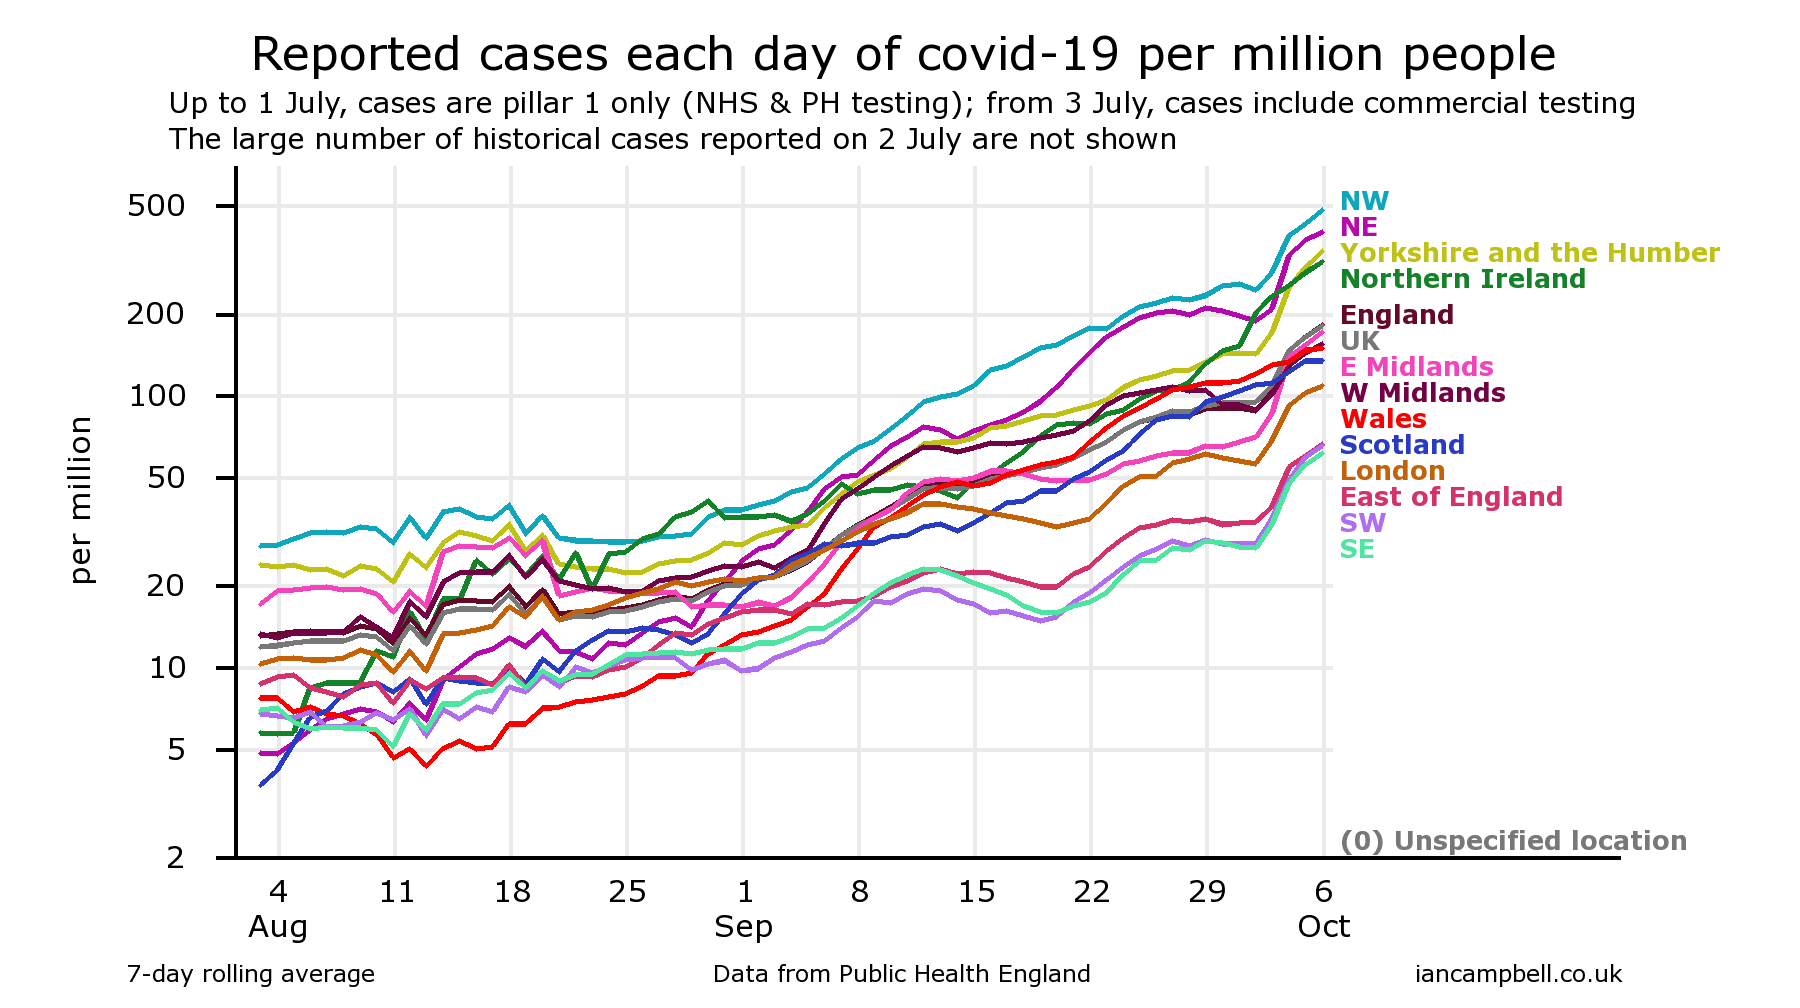
People often interpret the figures as showing that the problem of increasing cases is greatest in the north of England. But the logarithmic plot above shows that cases are rising in all areas with similar doubling times (similar slopes on a logarithmic chart).
Why count cases?
Sometimes, people ask why count cases rather than admissions to hospital or deaths (on the basis that serious illness and death are the more important than cases with minor symptoms).The reason is that cases are the best measure of whether we are winning or losing against the virus. If cases are rising, then admissions will rise soon after and deaths will rise soon after that. Basing decisions on admissions or deaths means delaying action, and increasing the total number of deaths, long term health problems and economic damage. Also the lower numbers of admissions and deaths means greater proportional day-to-day random variation, and so trends are harder to pick up, adding to delays in taking effective action.
The charts were generated by the online chart-drawing facility at https://www.iancampbell.co.uk/covid-19.php. Up-to-date charts can be obtained from there.
First published 23 Mar 2020
Last updated: 29 Oct 2020
Summary The toll of deaths and other consequences Deaths per day New cases per day UK "Global Death Comparison" chart UK nation and regional comparisons Poor UK Government decision making NHS/PHE labs are being denied testing reagents Unspecified case location in 70% of UK cases Problems with the covid-19 science Problems with the media and covid-19 Reasons to be concerned Reporting delays in Liverpool for covid-19 tests Action needed Elimination of the virus ("Zero covid") Elimination successes Population ("herd") immunity Countries with the best covid-19 control: half-lives of 5 days When to end the UK lockdown Predicting epidemics - Q and A R values, doubling times and halving times Data sources Data sources for covid-19.php Seven principles of public life in the UK Myths and misinformation About